Often times the subject of reporting is ignored until the tail end of development. Sometimes this is due to a lack of understanding of how the application will be utilized or how the end user wants to manage their data. Or, more likely, meaningful unit testing is easier once you’ve already built and tested the application and produced some verifiable test data. Either way, if you’re already using SmartClient’s javascript framework, there are a bevy of options for creating charts and graphs, exporting to a spreadsheet, and outputting data to a PDF document.

If you’re not already familiar with SmartClient you can see an overview from a previous blog or view examples on Isomorphic’s website. The SmartClient framework provides multiple tools for viewing and editing data, the most common being the ListGrid. But all the data display tools are extensions of the DataboundComponent class which provides the necessary functions.
Adding Charts with SmartClient
Adding charts and graphs always provides some eye candy to your application while also providing a simple visual representation of your data. SmartClient provides an assortment of charts and graphs for displaying data but the following two examples best demonstrate the relationship between the data and the display:
- Grid Charting– A major benefit of the SmartClient framework is it’s ListGrid object. A ListGrid creates a dynamic HTML table structure and automatically pages data via jQuery into that table from your database. This example demonstrates how to synchronize a chart with data that is already being displayed in a ListGrid. Changes to the data in the grid automatically update the chart.
- Dynamic Data Charting– This is simple example of how to create a chart directly from your data source.
Datasource Files
SmartClient utilizes XML based datasource files which are an interface between your application and the database. Should you require summary or rollup data that isn’t already available in your application, a separate datasource can be created specifically for your report. All calculations and groupings are then done within your database queries defined within that datasource file. And SmartClient is flexible enough to allow stored procedures or database functions to be utilized as well as simple Select statements.
Exporting Data
Built into the DataboundComponent class are the basic methods for exporting data (exportData) that allow the user to download the data to their computer in the ListGrid to XML, JSON, CSV, XLS and COXML. So if you’ve already done the legwork and created a ListGrid for your application, you’re one function call away from providing export functionality. Isomorphic’s example of this is provided here. Below is a simple example of the code that produces a ListGrid and an Export button:
<script>

                // Create a "clientOnly" datasource that represents a Code table.

                var dsCodeTable = isc.DataSource.create( {

                                name: "codeTable",

                                clientOnly: true,

                                fields: [

                                                { name: "ID", type: "number", primaryKey: true },

                                                { name: "CODE", type: "text" },

                                                { name: "DESCRIPTION", type: "text" }

                                ],

                                testData:

                                [

                                                { "ID": 19999, "CODE": "A", "DESCRIPTION": "First" },

                                                { "ID": 29999, "CODE": "B", "DESCRIPTION": "Second" },

                                                { "ID": 39999, "CODE": "C", "DESCRIPTION": "Third" },

                                                { "ID": 49999, "CODE": "D", "DESCRIPTION": "Fourth" },

                                                { "ID": 59999, "CODE": "E", "DESCRIPTION": "Fifth" },

                                                { "ID": 0, "CODE": "", "DESCRIPTION": "None of the Above" }

                                ]

                });


                // Add the code table to a ListGrid.

                var gridCodeTable = isc.ListGrid.create( {

                                canEdit: true,

                                ID: "CodeTableGrid",

                                editEvent: "click",

                                dataSource: dsCodeTable,

                                autoFitData: true,

                                autoFetchData: true,

                                height: 130

                });


                // This is creates the Export button

                var buttonExport = isc.IButton.create({

                                ID: "ButtonExport",

                                title: "Export Data",

                                click: function () {

                                                // Note: "exportClientData" is used instead of "exportData" because

                                                //            the datasource is "clientOnly: true"

                                                gridCodeTable.exportClientData( {exportFormat: "XML"} );

                                }

                });


                var layoutCodeTable = isc.VLayout.create( {

                                ID: "LayoutCodeTable",

                                width: 350,

                                autoSize: true,

                                membersMargin: 5,

                                members: [ gridCodeTable, buttonExport ] // Add the grid and button layout to the vertical layout.

                } );


                // Display the layout on the screen.

                layoutCodeTable.show();

</script>
Which produces the following:
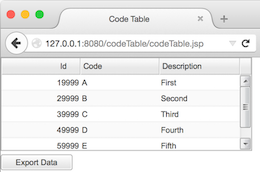
Figure 1
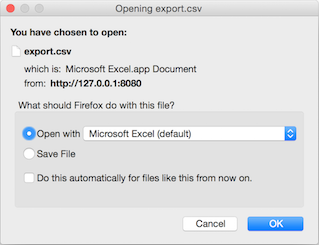
Figure 2
PDF Files
Creating output PDFs files in the past used to always be somewhat of a dark art. However, the frameworks available today make it much easier to do the heavy lifting with built in tools. SmartClient is no exception. It provides a single method, exportContent, as part of the RCPManager class. The RCPManager class handles transparent remote procedure calls which are sent to the web application server for processing and the results returned to the client. The exportContent function creates a printable HTML representation of any layout on the screen and directly imports it into a PDF format available for download.
Modifying the above code example, we can simply add another “PDF” button that initiates a PDF file download in your browser. It calls the exportContent function with the appropriate properties that give a base filename (pdffile) and apply a particular CSS style (skinname).
<script>

                // Create a "clientOnly" datasource that represents a Code table. * see previous example for the properties

                var dsCodeTable = isc.DataSource.create{ … });


                // Add the code table to a ListGrid.   * see previous example for the properties

                var gridCodeTable = isc.ListGrid.create({ … });


                // This is creates the Export button.  * see previous example for the properties

                var buttonExport = isc.IButton.create({ … });


                // Added this button to initiate the PDF creation/download.

                var buttonPDF = isc.IButton.create({

                                ID: "ButtonPDF",

                                title: "PDF",

                                click: function () {

                                                var settings = {

                                                                skinName: "Enterprise",

                                                                pdfName: "export”

                                                };

                                                isc.RPCManager.exportContent( layoutCodeTable, settings );

                                }

                });


                // Added a Horizontal Layout so the buttons will appear side by side.

                var buttonLayout = isc.HLayout.create({

                                ID: "hLayout",

                                membersMargin: 5,

                                align: "center",

                                members: [ buttonExport, buttonPDF ]

                });


                var layoutCodeTable = isc.VLayout.create( {

                                ID: "LayoutCodeTable",

                                width: 350,

                                autoSize: true,

                                membersMargin: 5,

                                members: [ gridCodeTable, buttonLayout ] // Add the grid and button layout to the vertical layout.

                } );


                // Display the layout on the screen.

                layoutCodeTable.show();

</script>
This produces the following:
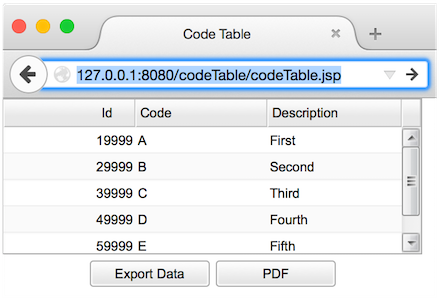
Figure 3
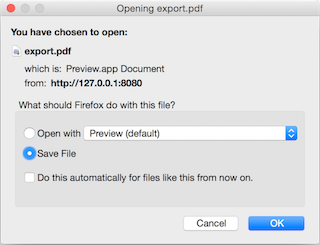
Figure 4
Which, once opened, produces the following PDF content:
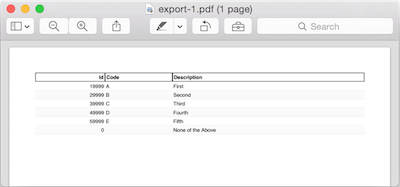
Figure 5
Isomorphic’s SmartClient provides the basic export, reporting, and charting functionality right out of the box to make report development a stress free task.


